Week #6 #
Frontend Development #
- Developed a new page that displays detailed information about applications. This page is designed to provide users with comprehensive data about their applications, including metrics and logs.
- Successfully connected the frontend to the backend, ensuring seamless data flow and interaction between the user interface and the server.
Backend Development #
- Finished the work on role-based authentication. This feature ensures that users have appropriate access levels based on their roles, enhancing security and access control.
- Integrated monitoring into application information by creating dynamic links for users. This allows users to easily access monitoring data relevant to their applications directly from the application interface.
Monitoring #
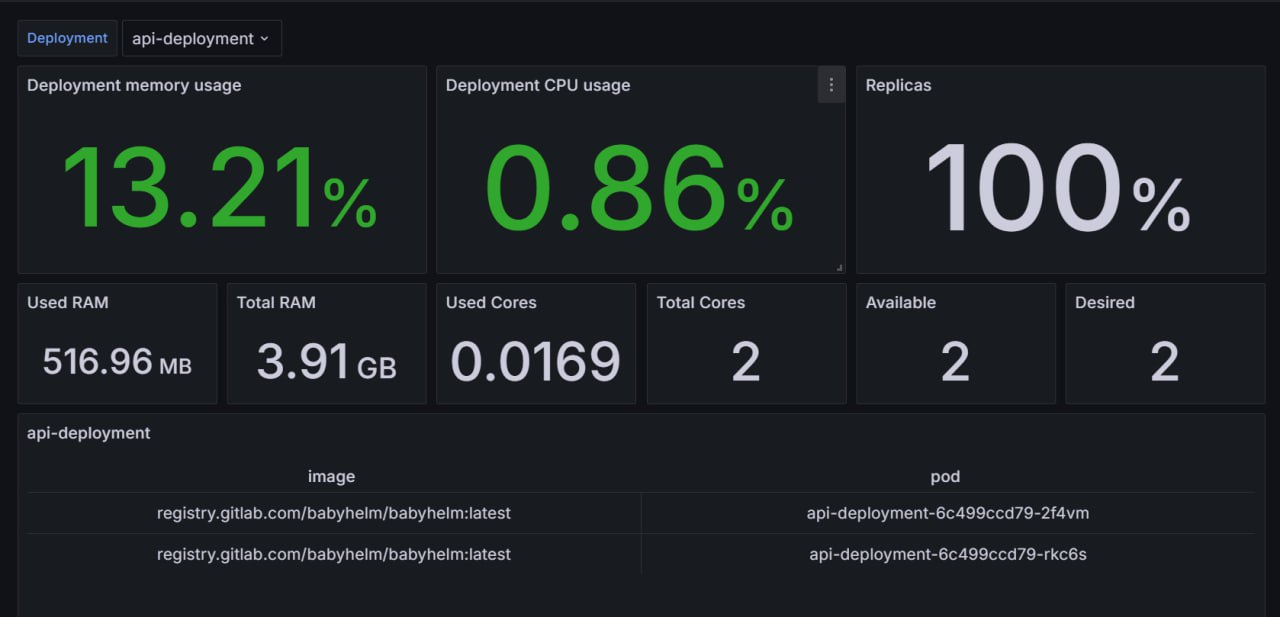
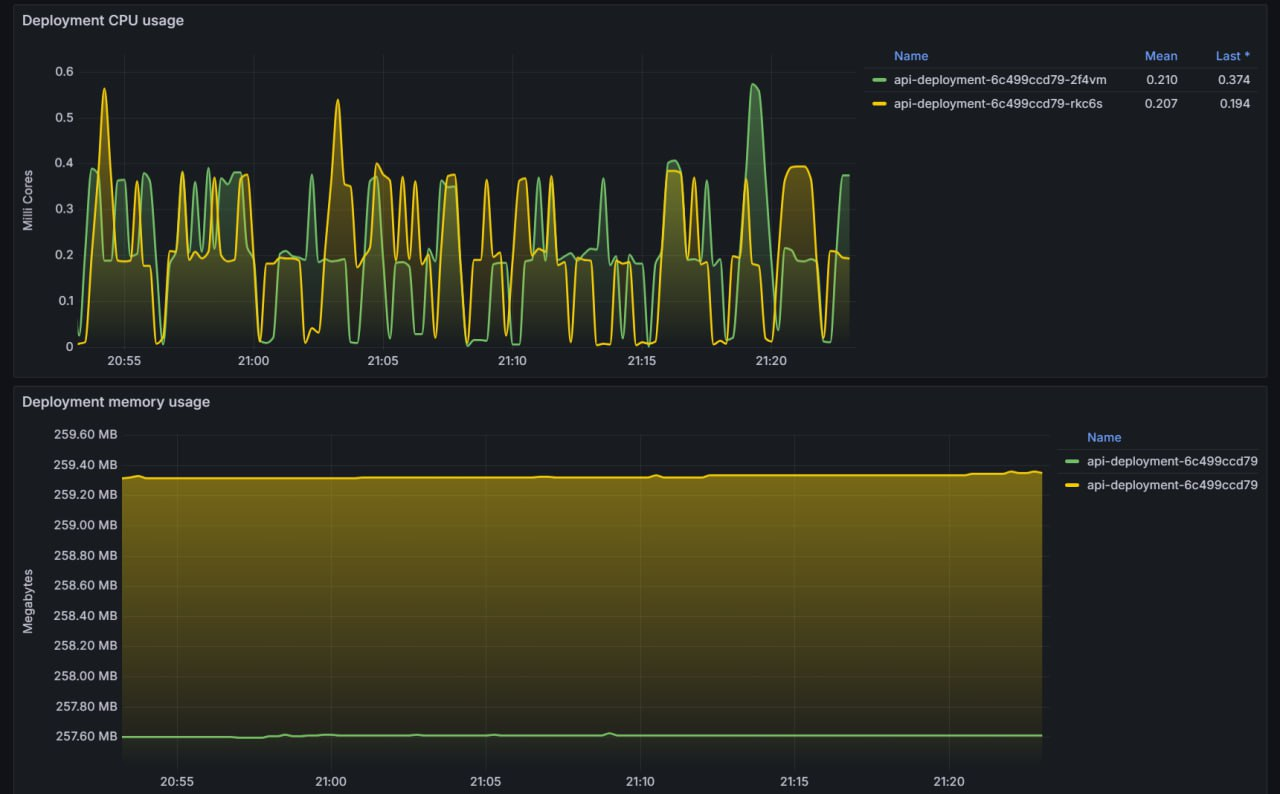
- Created a parser for metrics and successfully integrated it into Grafana. This allows us to efficiently collect and display relevant metrics in a user-friendly manner.
- Developed new, fully functional dashboards in Grafana. These dashboards provide comprehensive insights into various aspects of the system, enabling better monitoring and troubleshooting.
- Implemented logs output for applications, ensuring that detailed logs are available for all applications. This will help in diagnosing issues and understanding application behavior.
Market entry plan #
We conducted a thorough analysis of our target segment and market size. This analysis helps in understanding the potential customer base and the market dynamics. So we calculated the market size using various market layers, which include Potential Available Market (PAM), Total Addressable Market (TAM), Serviceable Available Market (SAM), and Serviceable Obtainable Market (SOM).
Market Validation
- Potential Available Market (PAM): The total number of developers globally is estimated to be approximately 26.9 million. This represents the maximum number of potential customers for our product.
- Total Addressable Market (TAM): Out of the total developer population, we estimate that 60% are realistically involved in deployment roles. This includes DevOps engineers and developers (backend and full stack) who handle deployment tasks. Thus, the TAM is approximately 16.14 million developers.
- Serviceable Available Market (SAM): Focusing on a specific segment, we estimate that there are about 1.5 million developers in Russia. Of these, 70% are involved in deployment activities, resulting in a SAM of approximately 1.05 million developers.
- Serviceable Obtainable Market (SOM): Assuming a 20% market share in deployment automation tools, our SOM is approximately 0.21 million developers.
Revenue Projections
The cost will vary depending on the resources the user requires. The minimum cost per month will be 5$. The optimal tariff to the user will cost 20$.
- PAM Revenue: If we assume a minimum cost of $5 per month per user, the potential revenue from the PAM would be 26.9 million developers * $5/month = $134.5 million per month.
- TAM Revenue: With the same pricing assumption, the potential revenue from the TAM would be 16.14 million developers * $5/month = $80.7 million per month.
- SAM Revenue: For the SAM, the potential revenue would be 1.05 million developers * $5/month = $5.25 million per month.
- SOM Revenue: Finally, for the SOM, the potential revenue would be 0.21 million developers * $5/month = $1.05 million per month.
Plan Before Final Presentation #
- Fix frontend errors to ensure proper interaction with the backend.
- Add documentation that is already in progress.